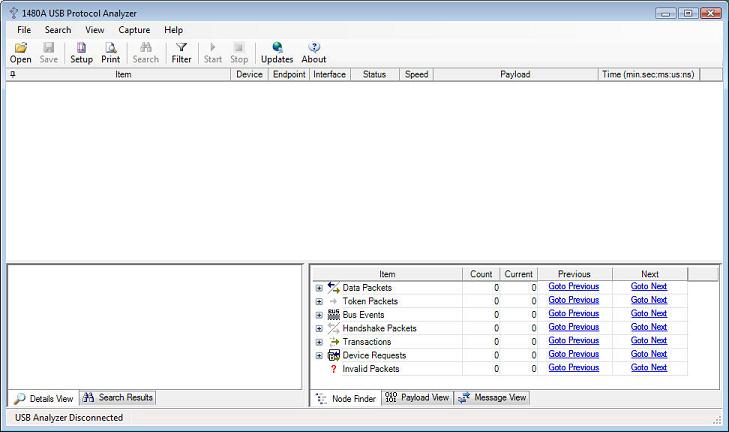
The 1480A USB Protocol Analyzer software is very easy to use. After having executed the software you'll see the below screen. This is the main screen which in the example below shows that the USB Analyzer is disconnected. Once you plug the 1480A USB analyzer to your PC and install the drivers (available on the installation CD) the status changes to 'USB Analyzer Connected'. If no 1480A USB Analyzer hardware is connected the software will still be able to display the enclosed pre-captured .usb files.
To view pre-captures files, simply select 'Open' from the 'File' menu. The USB Analyzer software ships with multiple pre-captured files:
- dvd_rw_drive.usb: External DVD R/W drive on HS bus (HS Device).
- fs_floppy.usb: External Floppy drive on HS bus (FS Device).
- fs_serial_dongle.usb: USB Serial port USB dongle on HS bus (FS Device).
- fs_serial_dongle_via_hub.usb: Serial port USB dongle (FS Device south of HS hub). Demonstrates SPLIT Packet decoding.
- hs_flash_key.usb: SanDisk Flash key (HS device).
- hs_harddisk.usb: External USB Harddisk (HS Device).
- hs_harddisk_(on_fs_controller).usb: External USB Harddisk (HS Device on FS Host Controller).
- ls_usb_mouse.usb: USB Mouse (LS device). Demonstrates Keep-Alive strobe decoding.
- ls_usb_mouse_via_hub(on_fs_controller).usb: USB Mouse (LS device). Demonstrates PRE Packet decoding.
- otg_fs_hnp.usb, otg_hs_hnp.usb: Demonstrates FS and HS OTG Host Negotion Protocol decoding.
- otg_fs_srp.usb: Demonstrates OTG Session Request Protocol decoding.
- otg_venus_gogo_b_device.usb: Demonstrates decoding of the OTG Descriptor.
The below image shows the connection sequence for the HS flash key device. Note that the LS and FS connection sequence is somewhat different due to the different nature of LS and FS devices (i.e. only HS devices go through the Chirp sequence). Note that the lower left 'details pane' displays information about the protocol node currently selected in the tree view (in this case 'Device Chirp').
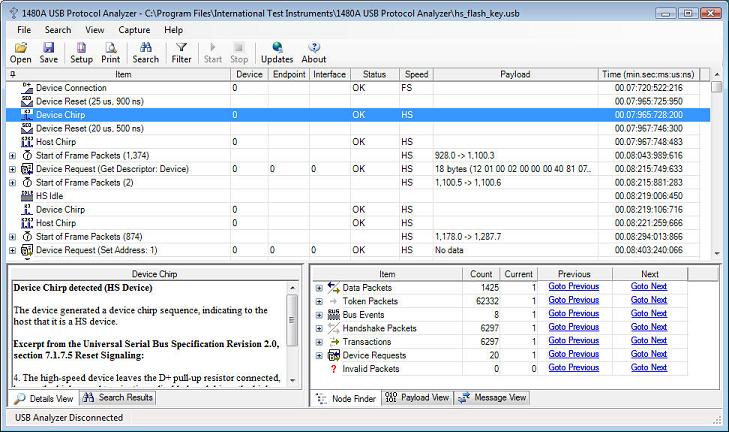
As can be seen in the above screenshot, the software decodes and displays the device connection, device chirp and host chirp sequence as the HS device is connected. Each event item in the display is timestamped with a 16.666 ns resolution (data is captured from the low-level PHY with a 60MHz clock which results in a 16.666ns resolution).
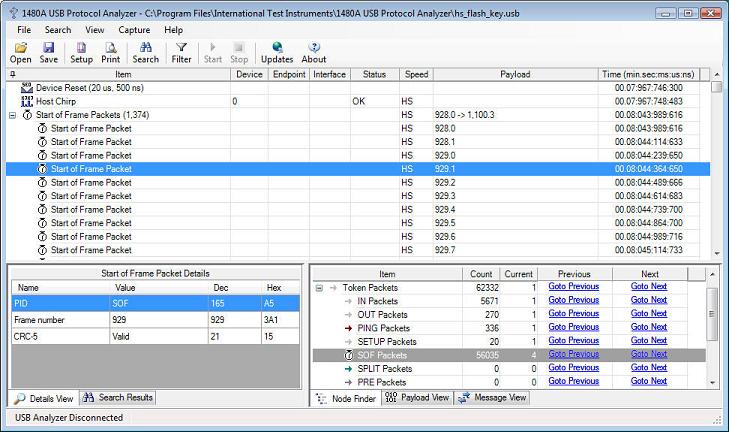
Consecutive, identical tree nodes (transactions or packets) are grouped together to make it easier to find the relevant information in the tree view. The image below shows how 1,374 SOF (Start of Frame) packets have been grouped into a single top-level node in the tree view. Note that the SOF packet details are displayed in the details view down to the left. Also note that the frame and micro-frame numbers are displayed in the Payload column. The Node Filter view down to the right allows you to easily locate Protocol Elements within the capture.
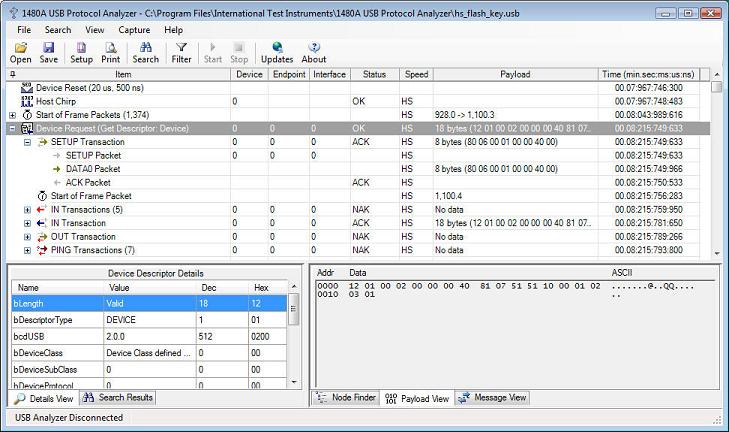
Continuing walking through the data captured during the HS device connection sequence, we see that the host retrieves the Device Descriptor from the device. This sequence is displayed in the below screenshot. Note how the Device Descriptor retrieved from the device is fully decoded in the Details View (titled 'Device Descriptor Details'). We see that the device descriptor is 18 bytes in length. We also see that the device is a 'SanDisk Corporation' device. Note how the default device (0) and control endpoint (0) are addressed (this is because all devices by default only respond to device ID 0 until their address is set via a SET ADDRESS device request. This is shown later in the trace). Also note how the payload of Device Requests, Transactions and Packets are displayed in the Payload View down to the right in the main window.
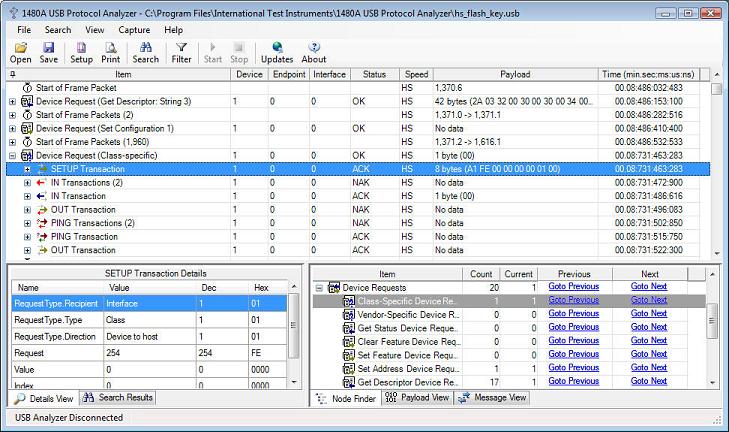
A Device Descriptor retrieval is done via a number of transactions. First a SETUP Transaction is sent to the device to let it know that the host will later retrieve the device descriptor data via an IN Transaction. The device in our case (see screenshot below) NAKs five times because it takes some time before it has the device descriptor available. The sixth IN Transaction succeeds (OK status) and the 18 bytes in the Device Descriptor is returned to the host. The below image shows how the SETUP Transaction is decoded in the Details View when clicked upon in the top tree view. The Details View (titled 'SETUP Transaction Details') shows the decoded information in the 8-byte SETUP Transaction that starts the 'Get Device'/'Get Descriptor' request (all control transfers are 8 bytes long).
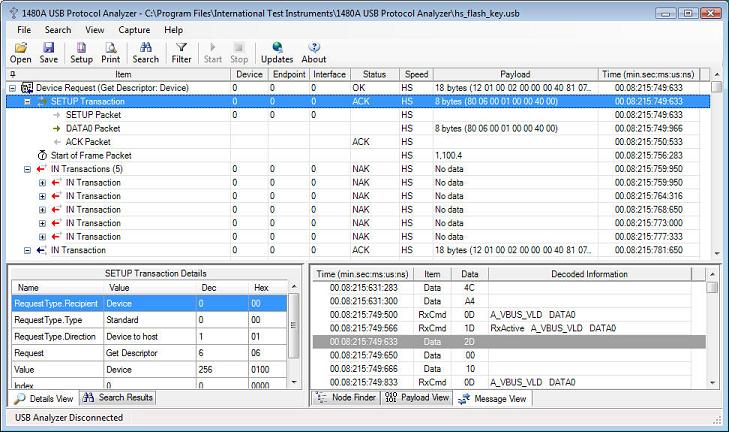
The above screenshot also shows how all the details of SETUP transactions are fully decoded in the details pane.
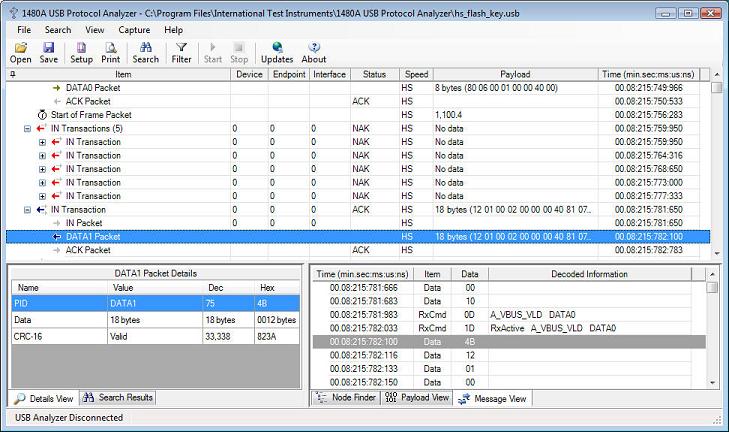
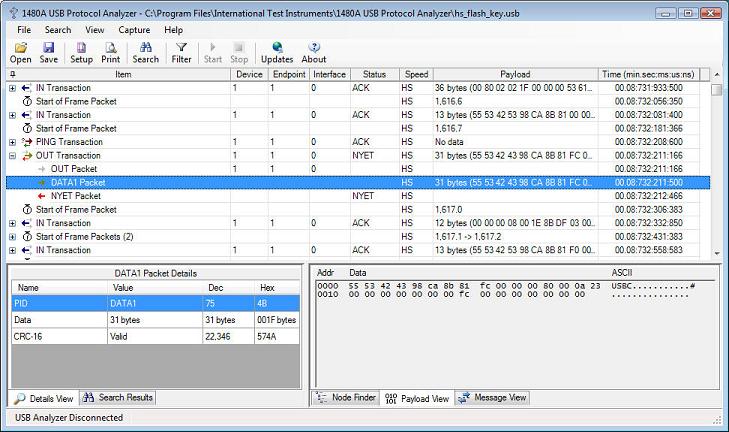
The below screenshot shows the IN Transaction that contains the DATA1 Packet that transfers the actual Device Descriptor data from the device. Note how the details pane decodes packet details when a packet is clicked upon in the main Protocol View. Also note that the Message View shows the actual low level messages as they are received from the Link Under Test.
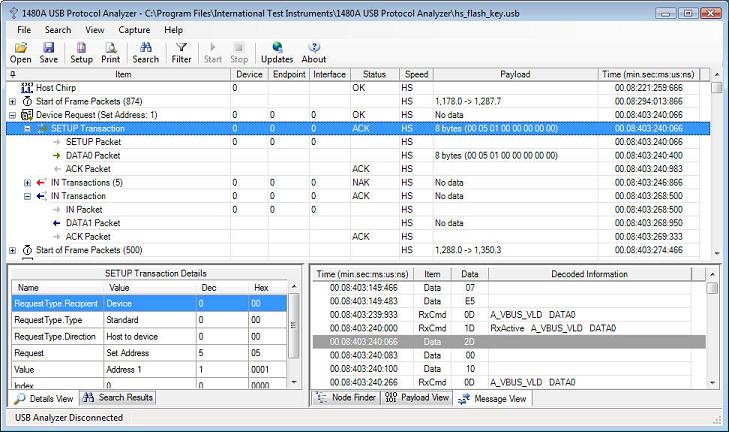
Later in the trace (at timestamp 00:08:403:240:066) the host is doing a 'Set Address' Device Request which assigns the device address 1. See the below screenshot for this Device Request. Note that the details pane decodes the 'Set Address' Device Request and that the 'Value' field is 'Address 1'. Note how the 'Set Address' Device Request is terminated when an (empty) IN Transaction successfully is ACKed:
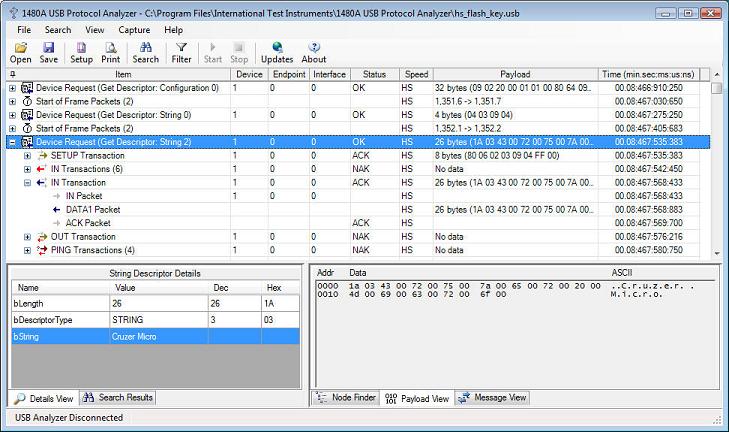
Most of the connection sequence continues in the same fashion; Descriptors are being retrieved in the following order: Device, Configuration 0, String 0, 3, Configuration 0, String 0, 2 etc. Each of these descriptors is being decoded and displayed in the Details View. The below screenshot shows how the 2nd string descriptor tells us that the device connected is a Cruzer Micro (a Flash Key). Also note that all packets after the 'Set Address' Device Request are now addressed to Device 1 (same device but new address). Note that the payload view shows the Unicode string in both binary and ASCII format.
When scrolling down in the trace to timestamp 00:08:731:463:283, we see a Class-Specific Device Request being displayed. The 1480A USB Analyzer software does not yet decode the meaning of class-specific device requests but the raw transactions and packets are displayed and hence, the meaning can be decoded 'by hand' by using the class-specification for the device used. Class-decoders will be available soon in our web store and you will be able to plug them in to the USB analyzer software without any hardware upgrades. At this time we have a target price of $199 per class-decoder (although this price might vary somewhat depending on the complexity of some class-decoders). See below screenshot for the class-specific request. Note that the Node Finder View was used to directly find the Class-Specific Device Request without having to manually find it in the trace.
The USB Analyzer software decodes and checks all DATA packet CRCs. Normally, this will always be valid unless you have data integrity problems or if your device calculates the CRC in firmware and you have a firmware bug in your device. Note the CRC-16 verified 'Valid' in the Details View down to the left.
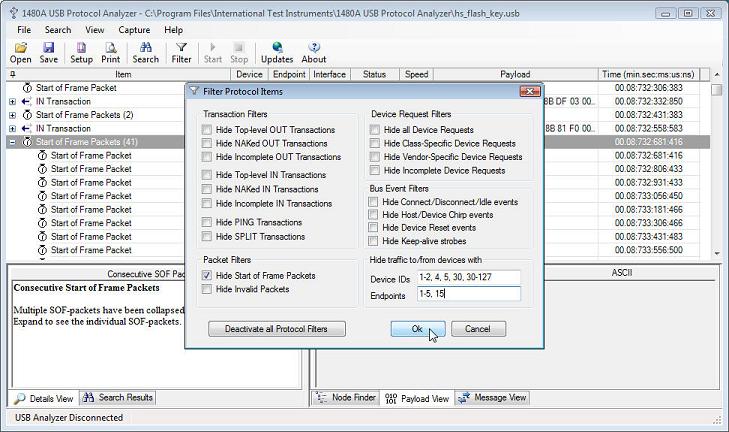
The 1480A USB Protocol Analyzer software also includes a powerful Protocol Filtering feature that allows you to hide frequently repeated Protocol Items from the main tree view. The below screenshot shows the 'Filter Protocol Items' dialog box in which Tree node objects can be hidden based on type, device ID or endpoint numbers. Both live and previously captured data can filtered in real-time. The data captured from the 1480A USB Analyzer is always stored to disk unfiltered, only the various Protocol Elements are hidden from view. This allows the full details of all captures to be analyzed at a later time regardless of the filter settings at capture time.
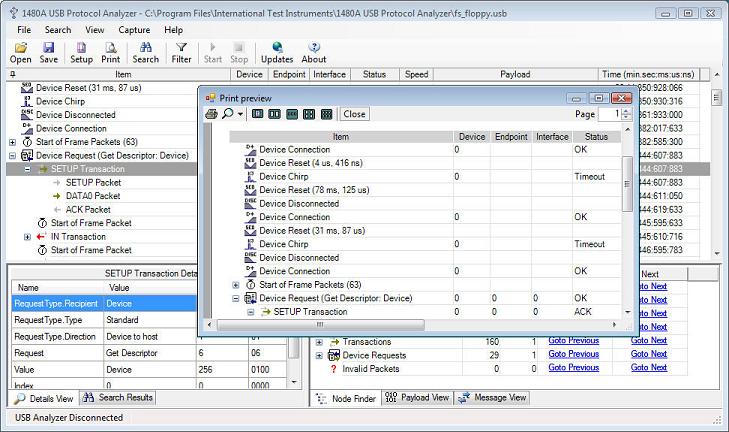
The 1480A USB Protocol Analyzer software also allows you to print the Protocol Tree. With the Adobe PDF Writer software you can easily output information to file and edit it later. The below screenshow shows the Print Preview dialog.
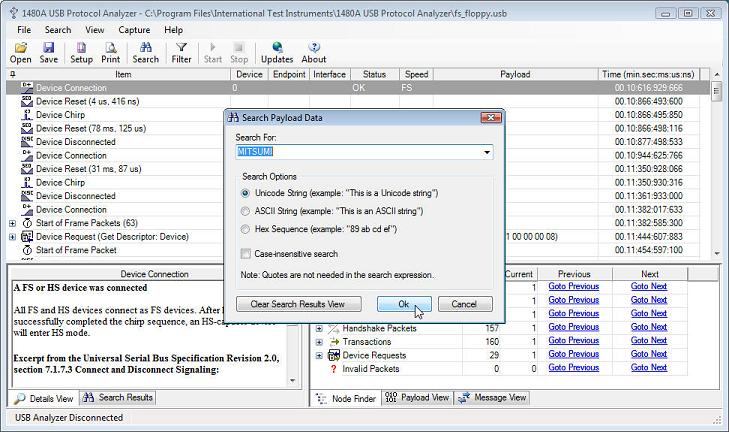
Version 3.1 of the 1480A Protocol Analyzer software introduces a high-performance Payload Search feature that allows searches for Unicode and ASCII strings as well as binary data in the data packet payload. The below screen shot shows how the Unicode string 'MITSUMI' is being searched for in the 'fs_floppy.usb' sample capture. Note that strings can be searched for in a case-sensitive as well as case-insensitive way.
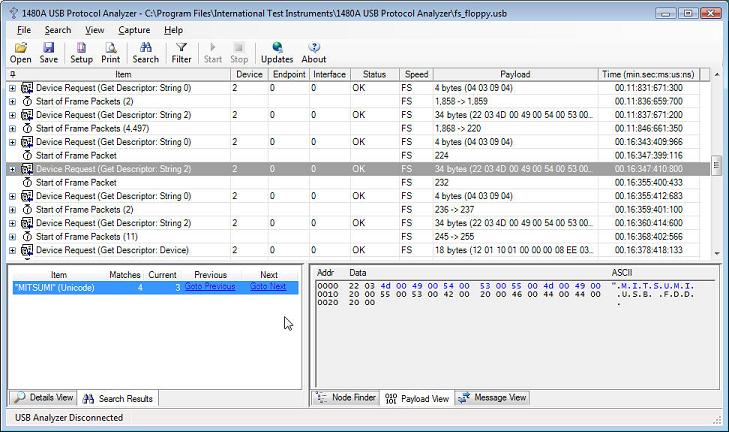
The results of all searches are displayed in the 'Search Results' View shown in the below screenshot. When clicking on a search result the main Protocol Tree View selects the node that contains the payload. Click the 'Goto Previous' and 'Goto Next' links to navigate through the matches found. The 'Payload View' also high-lights the data that matches the search. Search results can be cleared one at a time or all at once via a right-click pop-up menu or via the 'Search Payload Data' dialog (shown in the above screen shot).
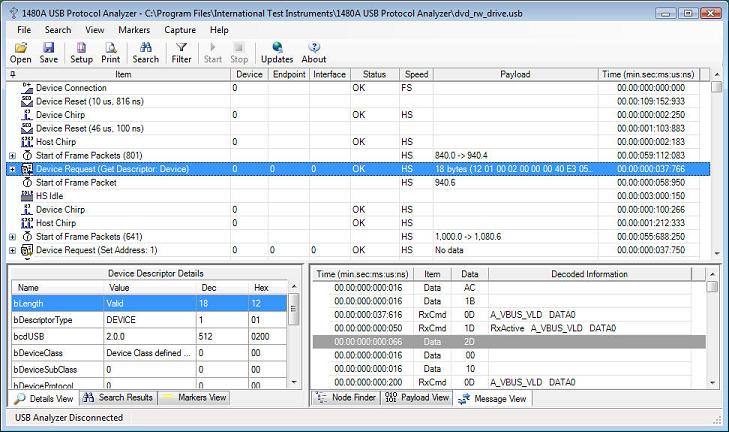
Versions 3.2 and 3.3 introduced relative and absolute timestamps as well as Set/Clear Time Reference commands. When selecting 'Relative Timestamps' from either the main menu or from one of the pop-up menus through out the application the timestamps indicate the time difference from the previous packet. The below screen shot illustrates this.
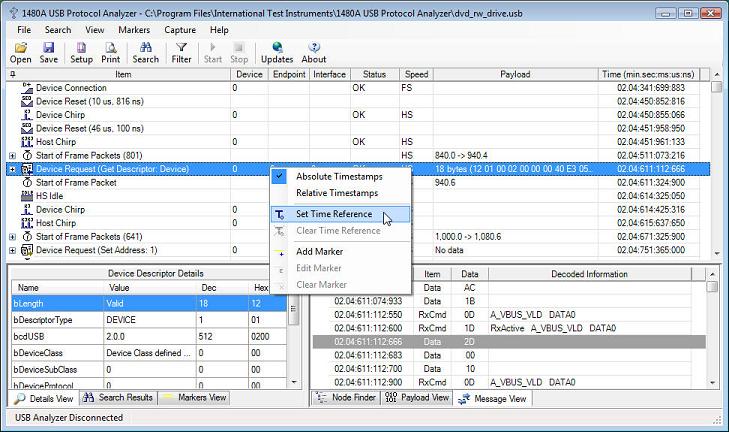
Note that all timestamps in the above screen-shot now display relative timestamps. When setting the time reference to a certain tree node, all timestamps are calculated as a time offset from the reference time stamp. The below screen-shots illustrate how this works.

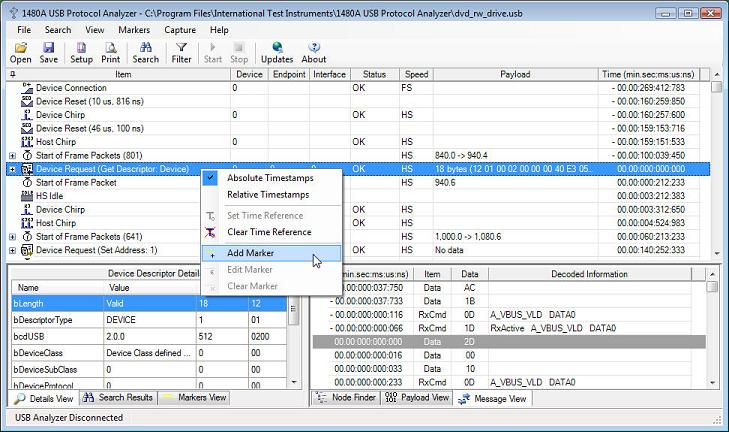
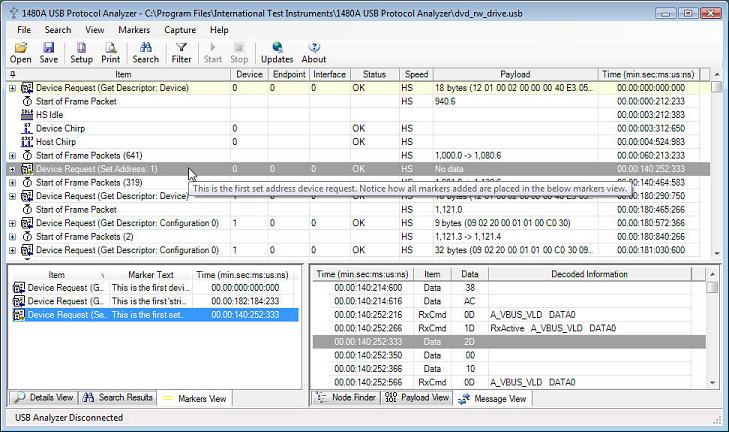
In order to measure time between two locations in the trace, cursors are commonly used. Also, bookmarks are also commonly used to insert arbitrary comments into the trace for later review. The cursor and bookmark concepts have in the 1480A Software been merged into a simple 'Marker' concept. A marker is inserted into the trace by right-clicking on a tree node in the main Protocol View and selecting 'Add Marker' from the pop-up menu. This is shown in the below screen-shots.
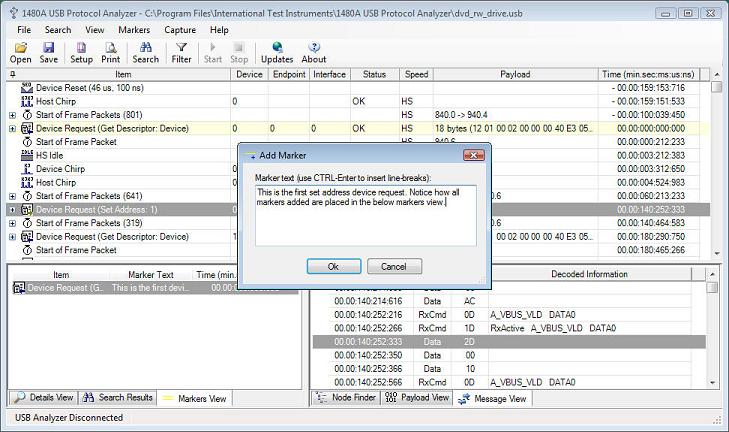
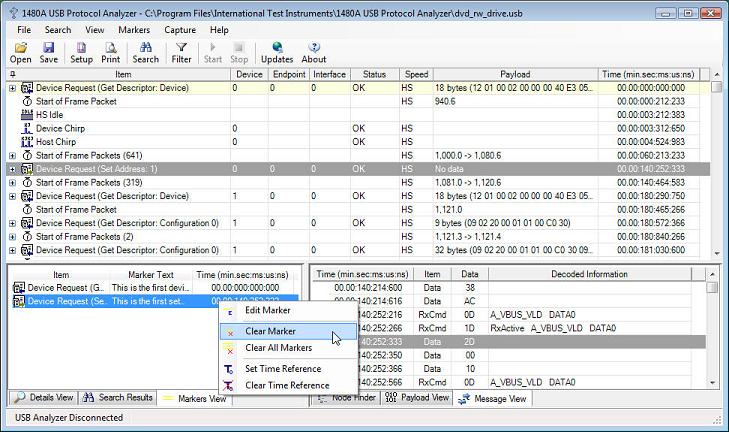
Note how the Protocol Item row has been set to a yellow color. This indicates that the row has been 'marked' by a marker. The 'Markers View' down to the left in the window displays all active markers. When clicking on a marker in the markers view, the main Protocol View will scroll to and high-light the marked Protocol View row. Markers can also be edited and cleared from the context-menu displayed when right-clicking in the markers view. The below screen shot shows this.
When hovering with the mouse over a marker a pop-up tool-tip displays the entered marker text. This is shown in the below screen shots.
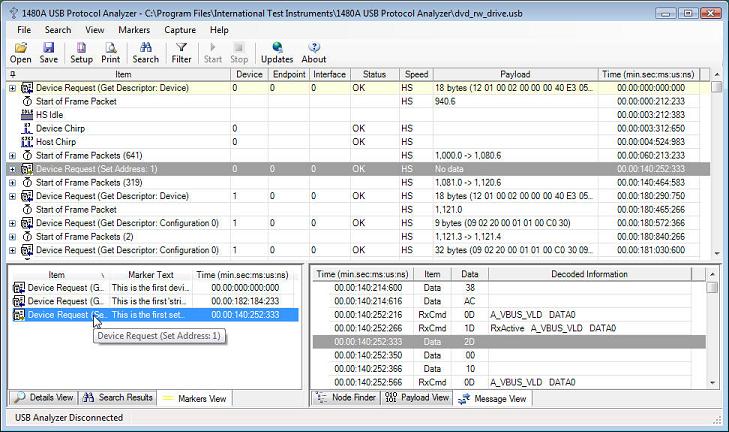
Note that when clicking one of the 'Item', 'Marker Text' and 'Time' columns in the 'Markers View', the markers view will be sorted (ascending or descending) accordingly to the information in the markers view. For instance, the above screen-shot shows the Markers View sorted accordingly to the 'Item' column (indicated by a little icon in the header for the 'Item' column). This marker sort feature makes it easy to find any marker in the trace.
OTG
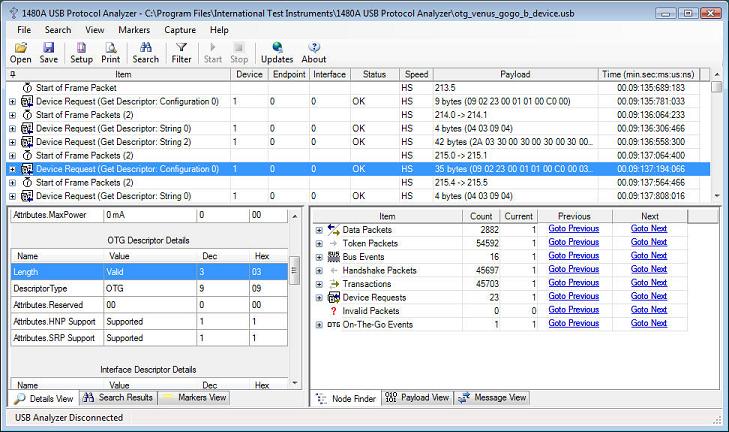
Version 3.4 of the 1480A Software introduced USB On-The-Go (OTG) Analysis. All OTG features are analyzed by the 1480A software including Session Request Protocol (SRP), Host Negotiation Protocol (HNP), VBus monitoring as well as decoding of the OTG Descriptor. The below screenshot shows the OTG Descriptor captured to the 'otg_venus_gogo_b_device.usb' sample file. As can be seen, the OTG Descriptor shows that this device supports both OTG HNP and SRP.
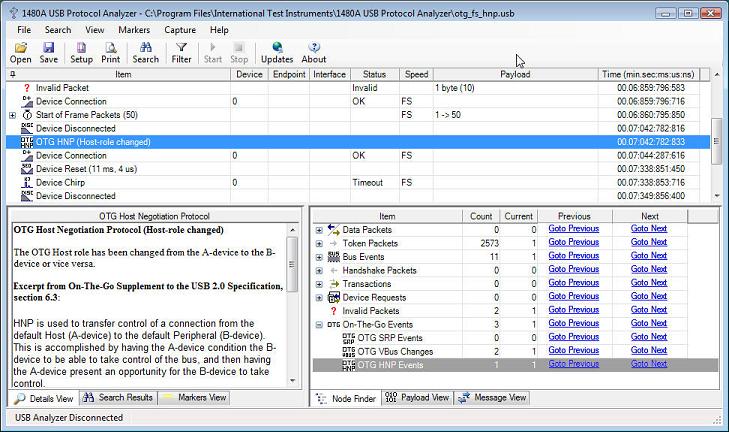
The next screenshot shows how OTG Events are listed in the Node Finder view. This makes it easy to find OTG events in the main Protocol View. Note how the the OTG Host role just has been changed when the B-device disconnected while being suspended. Sample files for HNP are available for both FS and HS devices.
The 1480A software also displays Session Request Protocol interactions as a device uses D+ and VBus pulsing to tell the host device to turn on VBus and initiate a new session. The below screen shot shows how an "OTG Session Request" tree node displays an SRP event in the trace.
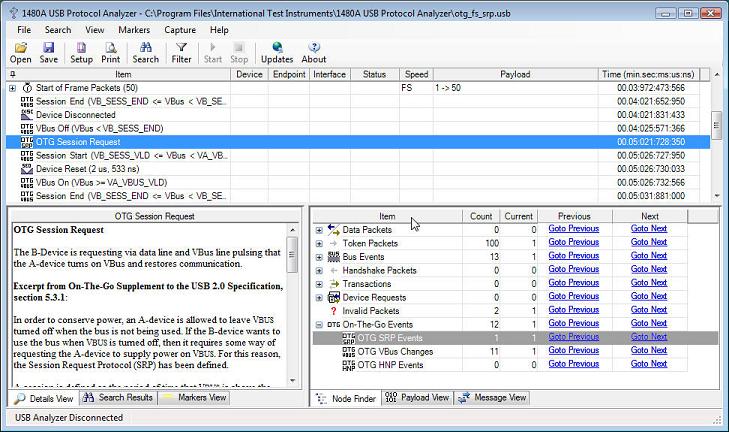
As also can be seen around the above "OTG Session Request" tree node, the 1480A OTG additions also display OTG VBus events. The displayed VBus events are; Session Start, Session End, VBus On and VBus Off. The bus voltage is continuously monitored by the 1480A hardware and is, in real-time, stored together with the rest of the captured protocol data. This allows you to know if the bus voltage for some reason falls below the valid levels during device operation (useful particularly for bus-powered devices). The Vbus voltage is monitored for all devices, not only for OTG devices.
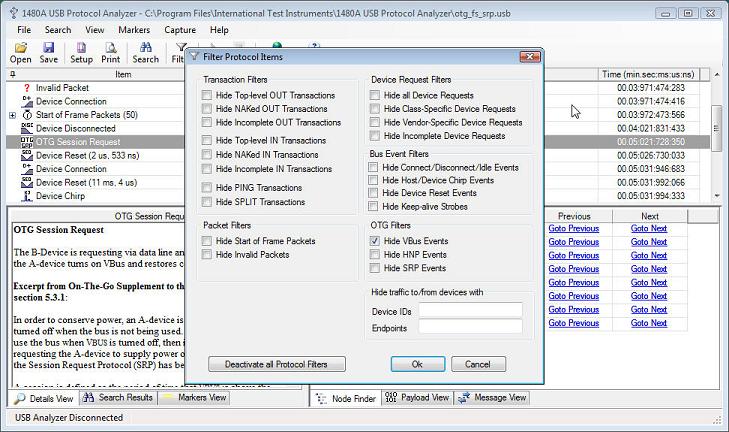
Since OTG events can clutter the rest of the protocol trace (especially true for the VBus events), all OTG events can selectively be turned off via the "Filter Protocol Items" dialog. The below screen shot shows the result of this for the 'otg_fs_srp.usb' sample trace previously shown above.
Version 3.5 of the 1480A software introduced a 'Discovered Devices' View (see below image). The Discovered Devices View will display information for all devices discovered in the captured data trace. The more detail that is available in the trace about devices, the more details will be shown in the Discovered Devices View. Normally, when a Device Descriptor is retrieved from a device, the Host Computer will learn the Vendor and Product IDs of the device and therefore uniquely can identify the device. The 1480A software uses the same method to identify a device in the Discovered Devices View.
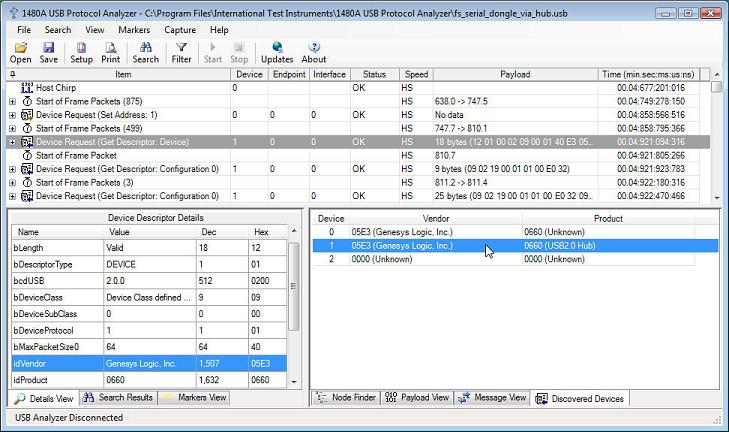
When selecting a row in the Discovered Devices View the first 'Device Descriptor' Device Request for that device is selected in the main Protocol View. If no Device Descriptor has been requested for a particular device in the trace then the first Token Packet addressed to the device is instead selected in the main Protocol View.
This concludes this overview of the capabilities of the USB Analyzer software. Please compare the data presentation and decoding capabilities with other USB Bus Analyzers and we are confident that our software will rank high in any comparison with much more expensive USB bus Analyzers. It is our goal to simply provide better tools for half the price so if you are missing features you would like to see in the 1480A software please contact us via the support forum or the Contact Us form.